Abstract
Brain signals extracted through brain-computer interface systems (BCI2000- http://www.bci2000.org) allow researchers and computer scientists to cooperate with techniques, mathematical models and statistical inferences that allow the interpretation of a variety of signals provided by people with conditions that significantly affect the ability to move or perform motor activities due to limitations in muscles, bones or nervous system. For this study, we propose a preliminary test with the root mean square (rms) fluctuation function, with EEG data, whose task was the response given to real/imaginary motor stimulus. To validate the model and all the steps up to the configuration of the rms function, we chose the information contained in the EEG of subject S003, available in the public database https://physionet.org/content/eegmmidb/1.0.0/. Considering the distribution of electrodes in the brain (lobes: frontal, parietal, temporal and occipital) and given the data availability conditions (10 - 10 system, EDF format and 160 samples per second), we analyzed 12 of the 64 channels and four stimuli, namely: opening and closing the left or right fist, imagining opening and closing the left or right fist, opening and closing both fists or both feet and imagining opening and closing both fists or both feet. We evaluated their fluctuations individually and the amplitudes of channels 32 and 37 in relation to the others (11, 22, 24, 43, 44, 49, 54, 61, 63 and 64). We observed quantitative similarities when the brain performs the same real/imaginary motor task and that the time of the amplitude changes with the increase of the scale n (time scales). In all experiments (S003_R3, S003_R4, S003_R5, S003_R6), channel 32 x 24, for n > 20 (15 seconds) was smaller than the others, showing that channel 32 (left hemisphere) has the largest fluctuation. From data processing (.EDF) to visualization of FDFA/∆log curves, we conclude that it is possible to replicate the study for more channels, as well as to investigate other types of activities in the human brain adapted to potential variations (DDP) generated by neurons via signals extracted from the EEG device.
Keywords
Time Series, RMS Fluctuation Function, Electroencephalogram (EEG)
1. Introduction
The electroencephalogram (EEG) is a non-invasive, safe and widely used tool for assessing brain electrical activity. It is performed using electrodes placed on the scalp that capture and record brain electrical impulses
. These impulses are responsible for the activities performed by the human body, transmitted as brain commands through cells called neurons
| [1] | BLINOWSKA, Katarzyna; DURKA, Piotr. Electroencephalography (eeg). Wiley encyclopedia of biomedical engineering, 2006. https://doi.org/10.1002/9781118901731.iecrm0080 |
| [2] | SOUFINEYESTANI, Mahsa; DOWLING, Dale; KHAN, Arshia. Electroencephalography (EEG) technology applications and available devices. Applied Sciences, v. 10, n. 21, p. 7453, 2020. https://doi.org/10.3390/app10217453 |
[1, 2]
.
In terms of the importance of brain electrical activity, preliminary tests with mathematical/statistical models are used to understand and evaluate EEG signals given their importance in the medical field. The tracing and behavior generated from the EEG is interpreted in research as being an important step that evaluates the spontaneous potential difference (electrical activity) of the brain and uses it to identify a variety of neurological conditions
| [1] | BLINOWSKA, Katarzyna; DURKA, Piotr. Electroencephalography (eeg). Wiley encyclopedia of biomedical engineering, 2006. https://doi.org/10.1002/9781118901731.iecrm0080 |
| [2] | SOUFINEYESTANI, Mahsa; DOWLING, Dale; KHAN, Arshia. Electroencephalography (EEG) technology applications and available devices. Applied Sciences, v. 10, n. 21, p. 7453, 2020. https://doi.org/10.3390/app10217453 |
| [3] | Beres, A. M. Time is of the Essence: A Review of Electroencephalography (EEG) and Event-Related Brain Potentials (ERPs) in Language Research. Appl Psychophysiol Biofeedback 42, 247–255 (2017). https://doi.org/10.1007/s10484-017-9371-3 |
[1-3]
. Most models take into account the frequency domain (Hz), for example the Fourier transform or time series, for example the Detrended fluctuation analysis (DFA) method
| [10] | Zebende, G. F., Oliveira-Filho, F. M., and Leyva-Cruz, J. A. (2017). Autocorrelation in the motor/imaginary human EEG signals: A vision about the FDFA fluctuations. PLOS ONE, 12(9). https://doi.org/10.1371/journal.pone.0183121 |
| [11] | Oliveira-Filho, F. M., Leyva-Cruz, J. A., and Zebende, G. F. (2019). Analysis of the EEG bio-signals during the reading task by DFA method. Physica A, 525: 664-671. https://doi.org/10.1016/j.physa.2019.04.035 |
| [12] | SAMIEE, Kaveh; KOVACS, Peter; GABBOUJ, Moncef. Epileptic seizure classification of EEG time-series using rational discrete short-time Fourier transform. IEEE transactions on Biomedical Engineering, v. 62, n. 2, p. 541-552, 2014. https://doi.org/10.1109/TBME.2014.2360101 |
[10-12]
.
The benefits of using EEG are associated with the diagnosis of seizure disorders, such as epilepsy, sleep monitoring, encephalopathic evaluation, psychiatric disorders, assessment of loss of consciousness, monitoring of anesthetic depth, response to real and imaginary motor stimuli, among others
| [4] | WILDE, Elisabeth A. et al. Loss of consciousness is related to white matter injury in mild traumatic brain injury. Journal of neurotrauma, v. 33, n. 22, p. 2000-2010, 2016. https://doi.org/10.1089/neu.2015.4212 |
| [5] | BAGNATO, S. et al. Prognostic value of standard EEG in traumatic and non-traumatic disorders of consciousness following coma. Clinical Neurophysiology, v. 121, n. 3, p. 274-280, 2010. https://doi.org/10.1016/j.clinph.2009.11.008 |
| [6] | HAUSER, W. Allen. Seizure disorders: the changes with age. Epilepsia, v. 33, p. 6-14, 1992. https://doi.org/10.1111/j.1528-1157.1992.tb06222.x |
| [7] | MESQUITA, Victor Barreto; OLIVEIRA FILHO, Florêncio Mendes; RODRIGUES, Paulo Canas. Detection of crossover points in detrended fluctuation analysis: an application to EEG signals of patients with epilepsy. Bioinformatics, v. 37, n. 9, p. 1278-1284, 2021. https://doi.org/10.1093/bioinformatics/btaa955 |
| [8] | FAHY, Brenda G.; CHAU, Destiny F. The technology of processed electroencephalogram monitoring devices for assessment of depth of anesthesia. Anesthesia & Analgesia, v. 126, n. 1, p. 111-117, 2018. https://doi.org/10.1213/ANE.0000000000002331 |
| [9] | ZHANG, X.-S.; ROY, Rob J.; JENSEN, Erik W. EEG complexity as a measure of depth of anesthesia for patients. IEEE transactions on biomedical engineering, v. 48, n. 12, p. 1424-1433, 2001. https://doi.org/10.1109/10.966601 |
[4-9]
. In terms of real and imaginary motor stimuli, we are referring to the ability of EEG to capture brain responses such as merely opening and closing the hands or moving the feet
| [10] | Zebende, G. F., Oliveira-Filho, F. M., and Leyva-Cruz, J. A. (2017). Autocorrelation in the motor/imaginary human EEG signals: A vision about the FDFA fluctuations. PLOS ONE, 12(9). https://doi.org/10.1371/journal.pone.0183121 |
[10]
. The reasons for understanding a simple motor response lead many researchers to develop brain-computer interface (BCI) systems that provide communication and control capabilities for people with severe motor diseases. In summary, progress is the realization of practical applications, treatment methods, development of processing algorithms, output forms and operational protocols.
As an analysis tool and given its ease in modeling time series, especially the context and importance of EEG reading, we propose in this sample test to evaluate the performance of the Detrended fluctuation analysis (DFA) method and the rms fluctuation function (∆log) in a database available at physionet.org
| [13] | Schalk, G., McFarland, D. J., Hinterberger, T., Birbaumer, N., Wolpaw, J. R. BCI2000: A General-Purpose Brain-Computer Interface (BCI) System. IEEE Transactions on Biomedical Engineering 51(6): 1034-1043, 2004. https://doi.org/10.1109/TBME.2004.827072 |
| [14] | Goldberger, A., Amaral, L., Glass, L., Hausdorff, J., Ivanov, P. C., Mark, R.,... & Stanley, H. E. (2000). PhysioBank, PhysioToolkit, and PhysioNet: Components of a new research resource for complex physiologic signals. Circulation [Online]. 101 (23), pp. e215–e220. https://doi.org/10.1161/01.CIR.101.23.e21 |
[13, 14]
.
In this sense, this test seeks to design all the steps of the recent rms fluctuation function (∆log)
| [10] | Zebende, G. F., Oliveira-Filho, F. M., and Leyva-Cruz, J. A. (2017). Autocorrelation in the motor/imaginary human EEG signals: A vision about the FDFA fluctuations. PLOS ONE, 12(9). https://doi.org/10.1371/journal.pone.0183121 |
[10]
, with the purpose of configuring the method and testing it in the future on new bases. All the steps and understanding of this test in this article are organized as follows: a Materials and Methods section, with basic information and description of the DFA models and the rms fluctuation function and a Results and Discussion section, finally the Conclusion.
2. Materials and Methods
2.1. Database
All series analyzed in this test were taken from the database available at https://physionet.org/pn4/eegmmidb/. A subject (S003) was randomly selected from this database, we included the experiments: S003_R3, S003_R4, S003_R5 and S003_R6, in a group of three experiments per subject, these representing the first of the three. The experimental protocol is described in detail in subsection 2.2 (Experimental protocol). The data available by the database are in EDF (European Data Format) containing 64 channels, each with a sampling rate of 0.00625 seconds, and a reference channel. For this test with the rms fluctuation function, we chose channels 11, 22, 24, 32, 37, 43, 44, 49, 54, 61, 63 and 64. 32 and 37 were the channels chosen among the others because they presented the largest fluctuations in relation to the others. A detailed visualization of the position of the channels distributed in the brain can be seen at https://physionet.org/content/eegmmidb/1.0.0/64_channel_sharbrough.png.
2.2. Experimental Protocol
Below is a detailed description of the stimulus given to the subject who performed the real/imaginary motor tasks while the EEG records the channels (time series).
Tasks (1) S003_R3: A target appears on the left or right side of the screen. The subject opens and closes the corresponding fist until the target disappears. Then the subject relaxes. Tasks (2) S003_R4: A target appears on the left or right side of the screen. The subject imagines opening and closing the corresponding fist until the target disappears. Then the subject relaxes. Tasks (3) S003_R5: A target appears on the top or bottom of the screen. The subject opens and closes both fists (if the target is on top) or both feet (if the target is on bottom) until the target disappears. Then the subject relaxes. Tasks (4) S003_R6: A target appears on the top or bottom of the screen. The subject imagines opening and closing both fists (if the target is on top) or both feet (if the target is on bottom) until the target disappears. Then the subject relaxes.
2.3. DFA Method
To understand the Detrended fluctuation analysis (DFA) method proposed by Peng et al. (1994), consider a correlated signal sample of u(i) (EEG signal), where i = 1, cdots,
N, where N is the total number of points in the time series. We integrate the sign and obtain , where is the average of . The integrated signal is divided into boxes (without overlap) of the same size (time scale). For each box of size n, we fit yn(k) in each box using a first-order linear regression, which represents the trend of the box. The entire process is obtained using the least squares method. The integrated series is subtracted from the fitted series at each box size . Afterwards, for each box of size , the mean square root will be calculated (integrated signal and without trend), that is,
(1)
The calculation is repeated for a wide range of scales, i.e. Next, the function characterizes a power law of the type , where will be the long-range correlation indicator.
The interpretation of the relationship is given as follows: (antpersistent), (uncorrelated while noise), (long-range correlated persistent), (, (non-stationary) e (brownian noise).
At this stage, the
method enables the detection of long-range correlation and self-affinity embedded in apparently non-stationary time series and, above all, avoids the spurious detection of long-range correlations. Works that cite the DFA method
| [7] | MESQUITA, Victor Barreto; OLIVEIRA FILHO, Florêncio Mendes; RODRIGUES, Paulo Canas. Detection of crossover points in detrended fluctuation analysis: an application to EEG signals of patients with epilepsy. Bioinformatics, v. 37, n. 9, p. 1278-1284, 2021. https://doi.org/10.1093/bioinformatics/btaa955 |
| [10] | Zebende, G. F., Oliveira-Filho, F. M., and Leyva-Cruz, J. A. (2017). Autocorrelation in the motor/imaginary human EEG signals: A vision about the FDFA fluctuations. PLOS ONE, 12(9). https://doi.org/10.1371/journal.pone.0183121 |
| [11] | Oliveira-Filho, F. M., Leyva-Cruz, J. A., and Zebende, G. F. (2019). Analysis of the EEG bio-signals during the reading task by DFA method. Physica A, 525: 664-671. https://doi.org/10.1016/j.physa.2019.04.035 |
| [15] | OLIVEIRA FILHO, F. M. et al. Statistical study of the EEG in motor tasks (real and imaginary). Physica A: Statistical Mechanics and its Applications, v. 622, p. 128802, 2023. https://doi.org/10.1016/j.physa.2023.128802 |
| [16] | FILHO, Florencio Mendes Oliveira; ZEBENDE, Gilney Figueira. Temporal Coherence in the Synchronization of Brain Electrical Activity Patterns: An Application with the RMS Fluctuation Function. Journal ISSN, v. 2766, p. 2276, 2024. https://dx.doi.org/10.37871/jbres1885 |
| [17] | OLIVEIRA FILHO, Florêncio Mendes; GUEDES, Everaldo Freitas; RODRIGUES, Paulo Canas. Networks analysis of Brazilian climate data based on the DCCA cross-correlation coefficient. Plos one, v. 18, n. 9, p. e0290838, 2023. https://doi.org/10.1371/journal.pone.0290838 |
| [18] | Zebende, G. F. (2011). DCCA cross-correlation coefficient: Quantifying level of crosscorrelation. Physica A, 390(4): 614–618. https://doi.org/10.1016/j.physa.2010.10.022 |
| [19] | VASSOLER, R. T.; ZEBENDE, G. F. DCCA cross-correlation coefficient apply in time series of air temperature and air relative humidity. Physica A: Statistical Mechanics and its Applications, v. 391, n. 7, p. 2438-2443, 2012. https://doi.org/10.1016/j.physa.2011.12.015 |
| [20] | MENDES OLIVEIRA FILHO, FLORÊNCIO; SANTANA, J. P. C. Difference in the Range of Floating in Individuals Diagnosed with Amyotrophic Lateral Sclerosis: A Preliminary Study with the RMS Float Function. INTERNATIONAL JOURNAL OF RESEARCH IN ENGINEERING AND SCIENCE, v. 10, p. 01-06, 2022. ISSN (Online): 2320-9364, ISSN (Print): 2320-9356. |
[7, 10, 11, 15-20]
.
2.4. Rms Function
The proposal of the mean square fluctuation function (rms) by Florêncio, Zebende and Juan, 2017, arises from the idea of measuring the difference in the amplitude of the fluctuation between two EEG channels (temporal coherence)
| [10] | Zebende, G. F., Oliveira-Filho, F. M., and Leyva-Cruz, J. A. (2017). Autocorrelation in the motor/imaginary human EEG signals: A vision about the FDFA fluctuations. PLOS ONE, 12(9). https://doi.org/10.1371/journal.pone.0183121 |
[10]
. The tool is an addition to the DFA
method and has proven to be very useful for analyzing electrophysiological signals. Using the rms function, we can study how much two regions of the brain are correlated for the same scale and generalize to all points distributed in the brain. In practice, we calculate
FDFA of two time series generated by the EEG signal and its logarithm individually, then subtract the result from the logarithms, see equation (
2).
(2)
Thus, gives us information about the relative intensity of the rms fluctuation, i.e, if.
[i] > 0, the amplitude of the rms fluctuation function around the channel F32 in relation to the channel xx, is larger; [ii] = 0, the amplitude of the rms fluctuation function around the channel F32 with respect to the channel xx, is zero; [iii] < 0, the amplitude of the rms fluctuation function around the channel F32 in relation to the channel xx, is smaller.
The first time the rms function was used in the motor/imaginary experiment available at: http://www.physonmet.org, compared brain activities between channels 32, 37, 49 and 54 (protocol 10-10)
| [10] | Zebende, G. F., Oliveira-Filho, F. M., and Leyva-Cruz, J. A. (2017). Autocorrelation in the motor/imaginary human EEG signals: A vision about the FDFA fluctuations. PLOS ONE, 12(9). https://doi.org/10.1371/journal.pone.0183121 |
| [11] | Oliveira-Filho, F. M., Leyva-Cruz, J. A., and Zebende, G. F. (2019). Analysis of the EEG bio-signals during the reading task by DFA method. Physica A, 525: 664-671. https://doi.org/10.1016/j.physa.2019.04.035 |
| [13] | Schalk, G., McFarland, D. J., Hinterberger, T., Birbaumer, N., Wolpaw, J. R. BCI2000: A General-Purpose Brain-Computer Interface (BCI) System. IEEE Transactions on Biomedical Engineering 51(6): 1034-1043, 2004. https://doi.org/10.1109/TBME.2004.827072 |
[10, 11, 13]
.
3. Results and Discussion
With the understanding of the Detrended fluctuation analysis (DFA) method and the mean square fluctuation function (rms), subsection 2.3 and 2.4, we applied a test on 48 time series extracted from the EEG device with approximately 20,000 points at a sampling rate of 0.00625 seconds. All DFA and rms function steps were applied in experiments S003_R3, S003_R4, S003_R5 and S003_R6, subject S003 of the public database www.physionet.org. The channels were chosen to cover the entire brain (International 10-10 system of electrode positions), these being channels 11, 22, 24, 32, 37, 43, 44, 49, 54, 61, 63 and 64. 32 and 37. 32 and 37 were the reference channels for the test with the rms function for the simple reason that motor stimulus (opening and closing the hands or moving the feet) is more active for the frontal region. Studies that validate the frontal region as the most active for this motor stimulus
| [10] | Zebende, G. F., Oliveira-Filho, F. M., and Leyva-Cruz, J. A. (2017). Autocorrelation in the motor/imaginary human EEG signals: A vision about the FDFA fluctuations. PLOS ONE, 12(9). https://doi.org/10.1371/journal.pone.0183121 |
| [11] | Oliveira-Filho, F. M., Leyva-Cruz, J. A., and Zebende, G. F. (2019). Analysis of the EEG bio-signals during the reading task by DFA method. Physica A, 525: 664-671. https://doi.org/10.1016/j.physa.2019.04.035 |
[10, 11]
.
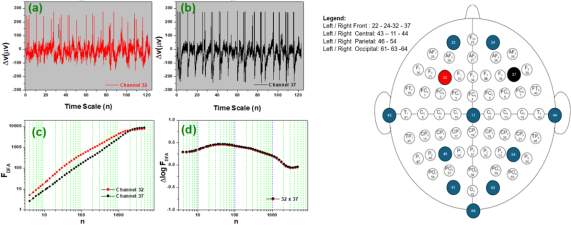
Figure 1 represents, as an example, all the steps used in the modeling up to the difference between two channels calculated by the rms function. The process was replicated for the 48 series. In (a) we have channel 32 in red and in (b) channel 37 in black. In (c) the DFA method was applied to the series representing channels 32 and 37 and in (d) we calculated their difference. On the right of the same figure, we have an illustration of the brain with the position of the electrodes used in the test.
Figure 1. Description of the steps that lead to the interpretation of the rms function, in four stages (a, b, c and d) on the left. On the right we have the representation of the candidate channels, chosen to represent the regions of the brain.
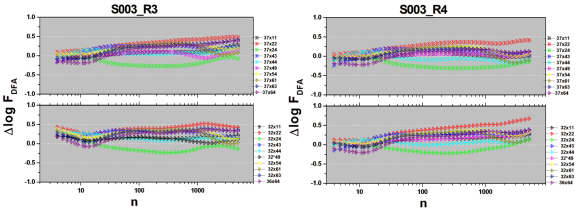
Figure 2. Task 1 and 2, experiment S003_R3 and S003_R4.
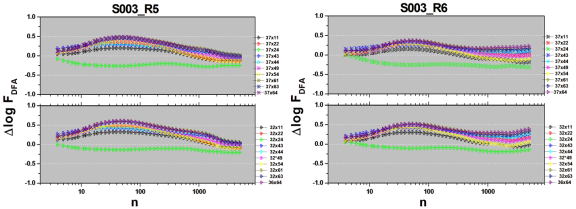
Figure 3. Task 3 and 4, experiment S003_R5 and S003_R6.
In
figures 2 and 3 we have the responses found with the DFA method and the rms function. In S003_R3, observing channel 32 in relation to the others. For small time scales (
≤ 4), the difference was evident for 32 x 22 with ∆log > 0 and 32 x 64 with ∆log < 0. The others showed variation around zero. The proportion that increases the scale (10 <
< 100), with the exception of 32 x 24, the difference is positive. For large scales (
> 1000), 32 x 24 we observed a difference around zero. In terms of reference,
= 100 corresponds to ≅ 1.0 minutes. This same behavior was observed in S003_R3, channel 37 in relation to the others.
The same analysis was done with S003_R4, for channels 32 and 37 in relation to the others. We can see here similar characteristics in the plot and behavior of the curves. One caveat for 32 x 44 and 37 x 44, which were more evident in terms of fluctuation. S003_R5 and S003_R6 followed the same line of analysis.
What we observed in these eight behaviors involving the imaginary real stimulus for subject S003 is that the response presented did not show great differences between performing a task and imagining performing a task. It is worth noting here that the base has 109 subjects who perform the motor test. Here we are only testing the ability to understand the technique with the commitment to replicate it for other neurological stimuli.
4. Conclusion
In this test, we seek to describe all the steps that lead to the understanding of the synchrony and organization of the patterns of electrical activity in the brain between regions (lobes: Frontal, Parietal, Temporal and Occipital) through the root mean square (rms) fluctuation function (∆log), from two reference channels. To model the steps, we chose a data set with EEG recordings (BCI2000 - http://www.bci2000.org) of approximately two minutes, a sample subject (S003), four tasks and 12 channels distributed throughout the brain.
In common with the literature, we evaluated the two most active channels 32 and 37 (greatest fluctuation). We measured the autocorrelations and verified that these differences for the real / imaginary motor response (temporal coherence) vary with the increase in scale. The results of the difference in fluctuation amplitude can be seen in
Figures 2 and 3 with the difference between channels 32 and 37 in relation to the others (11, 22, 24, 43, 44, 49, 54, 61, 63 and 64).
Finally, for this step, we showed that it is possible to replicate the technique for a larger number of subjects, and we understand that it becomes another strategy to understand brain coherence using EEG data.
Abbreviations
BCI | Brain Computer Interface |
EDF | European Data Format |
EEG | Electroencephalogram |
DFA | Detrended Fluctuation Analysis |
rms | Mean Square Fluctuation Function |
DDP | Potential Difference |
Acknowledgments
Florencio Mendes Oliveira Filho is grateful to Centro Universitario SENAI CIMATEC (Academic Innovation / Researcher Track - 02/2021-2022) and the National Council for Scientific and Technological Development (CNPq 25/2021) scholarship PDJ - 150655/2022-3. Zebende acknowledges financial support from CNPq Grant 310136/2020-2.
Author Contributions
Florêncio Mendes Oliveira Filho: Conceptualization, Data curation, Formal Analysis, Funding acquisition, Investigation, Methodology, Project administration, Resources, Software, Supervision, Validation, Visualization, Writing – original draft, Writing – review & editing
Pedro Henrique Barros de Oliveira: Conceptualization, Data curation, Formal Analysis, Investigation, Methodology, Software, Validation, Visualization
Sanval Ebert de Freitas Santos: Funding acquisition, Resources, Visualization
Alex Alisson Bandeira Santos: Funding acquisition, Resources, Visualization
Gilney Figueira Zebende: Methodology, Visualization
Conflicts of Interest
The authors declare no conflicts of interest.
References
| [1] |
BLINOWSKA, Katarzyna; DURKA, Piotr. Electroencephalography (eeg). Wiley encyclopedia of biomedical engineering, 2006.
https://doi.org/10.1002/9781118901731.iecrm0080
|
| [2] |
SOUFINEYESTANI, Mahsa; DOWLING, Dale; KHAN, Arshia. Electroencephalography (EEG) technology applications and available devices. Applied Sciences, v. 10, n. 21, p. 7453, 2020.
https://doi.org/10.3390/app10217453
|
| [3] |
Beres, A. M. Time is of the Essence: A Review of Electroencephalography (EEG) and Event-Related Brain Potentials (ERPs) in Language Research. Appl Psychophysiol Biofeedback 42, 247–255 (2017).
https://doi.org/10.1007/s10484-017-9371-3
|
| [4] |
WILDE, Elisabeth A. et al. Loss of consciousness is related to white matter injury in mild traumatic brain injury. Journal of neurotrauma, v. 33, n. 22, p. 2000-2010, 2016.
https://doi.org/10.1089/neu.2015.4212
|
| [5] |
BAGNATO, S. et al. Prognostic value of standard EEG in traumatic and non-traumatic disorders of consciousness following coma. Clinical Neurophysiology, v. 121, n. 3, p. 274-280, 2010.
https://doi.org/10.1016/j.clinph.2009.11.008
|
| [6] |
HAUSER, W. Allen. Seizure disorders: the changes with age. Epilepsia, v. 33, p. 6-14, 1992.
https://doi.org/10.1111/j.1528-1157.1992.tb06222.x
|
| [7] |
MESQUITA, Victor Barreto; OLIVEIRA FILHO, Florêncio Mendes; RODRIGUES, Paulo Canas. Detection of crossover points in detrended fluctuation analysis: an application to EEG signals of patients with epilepsy. Bioinformatics, v. 37, n. 9, p. 1278-1284, 2021.
https://doi.org/10.1093/bioinformatics/btaa955
|
| [8] |
FAHY, Brenda G.; CHAU, Destiny F. The technology of processed electroencephalogram monitoring devices for assessment of depth of anesthesia. Anesthesia & Analgesia, v. 126, n. 1, p. 111-117, 2018.
https://doi.org/10.1213/ANE.0000000000002331
|
| [9] |
ZHANG, X.-S.; ROY, Rob J.; JENSEN, Erik W. EEG complexity as a measure of depth of anesthesia for patients. IEEE transactions on biomedical engineering, v. 48, n. 12, p. 1424-1433, 2001.
https://doi.org/10.1109/10.966601
|
| [10] |
Zebende, G. F., Oliveira-Filho, F. M., and Leyva-Cruz, J. A. (2017). Autocorrelation in the motor/imaginary human EEG signals: A vision about the FDFA fluctuations. PLOS ONE, 12(9).
https://doi.org/10.1371/journal.pone.0183121
|
| [11] |
Oliveira-Filho, F. M., Leyva-Cruz, J. A., and Zebende, G. F. (2019). Analysis of the EEG bio-signals during the reading task by DFA method. Physica A, 525: 664-671.
https://doi.org/10.1016/j.physa.2019.04.035
|
| [12] |
SAMIEE, Kaveh; KOVACS, Peter; GABBOUJ, Moncef. Epileptic seizure classification of EEG time-series using rational discrete short-time Fourier transform. IEEE transactions on Biomedical Engineering, v. 62, n. 2, p. 541-552, 2014.
https://doi.org/10.1109/TBME.2014.2360101
|
| [13] |
Schalk, G., McFarland, D. J., Hinterberger, T., Birbaumer, N., Wolpaw, J. R. BCI2000: A General-Purpose Brain-Computer Interface (BCI) System. IEEE Transactions on Biomedical Engineering 51(6): 1034-1043, 2004.
https://doi.org/10.1109/TBME.2004.827072
|
| [14] |
Goldberger, A., Amaral, L., Glass, L., Hausdorff, J., Ivanov, P. C., Mark, R.,... & Stanley, H. E. (2000). PhysioBank, PhysioToolkit, and PhysioNet: Components of a new research resource for complex physiologic signals. Circulation [Online]. 101 (23), pp. e215–e220.
https://doi.org/10.1161/01.CIR.101.23.e21
|
| [15] |
OLIVEIRA FILHO, F. M. et al. Statistical study of the EEG in motor tasks (real and imaginary). Physica A: Statistical Mechanics and its Applications, v. 622, p. 128802, 2023.
https://doi.org/10.1016/j.physa.2023.128802
|
| [16] |
FILHO, Florencio Mendes Oliveira; ZEBENDE, Gilney Figueira. Temporal Coherence in the Synchronization of Brain Electrical Activity Patterns: An Application with the RMS Fluctuation Function. Journal ISSN, v. 2766, p. 2276, 2024.
https://dx.doi.org/10.37871/jbres1885
|
| [17] |
OLIVEIRA FILHO, Florêncio Mendes; GUEDES, Everaldo Freitas; RODRIGUES, Paulo Canas. Networks analysis of Brazilian climate data based on the DCCA cross-correlation coefficient. Plos one, v. 18, n. 9, p. e0290838, 2023.
https://doi.org/10.1371/journal.pone.0290838
|
| [18] |
Zebende, G. F. (2011). DCCA cross-correlation coefficient: Quantifying level of crosscorrelation. Physica A, 390(4): 614–618.
https://doi.org/10.1016/j.physa.2010.10.022
|
| [19] |
VASSOLER, R. T.; ZEBENDE, G. F. DCCA cross-correlation coefficient apply in time series of air temperature and air relative humidity. Physica A: Statistical Mechanics and its Applications, v. 391, n. 7, p. 2438-2443, 2012.
https://doi.org/10.1016/j.physa.2011.12.015
|
| [20] |
MENDES OLIVEIRA FILHO, FLORÊNCIO; SANTANA, J. P. C. Difference in the Range of Floating in Individuals Diagnosed with Amyotrophic Lateral Sclerosis: A Preliminary Study with the RMS Float Function. INTERNATIONAL JOURNAL OF RESEARCH IN ENGINEERING AND SCIENCE, v. 10, p. 01-06, 2022. ISSN (Online): 2320-9364, ISSN (Print): 2320-9356.
|
Cite This Article
-
APA Style
Filho, F. M. O., Oliveira, P. H. B. D., Santos, S. E. D. F., Santos, A. A. B., Zebende, G. F. (2024). Analysis of Electroencephalographic Signals Using the Root Mean Square (RMS) Fluctuation Function: Applicable Sample Test. Mathematical Modelling and Applications, 9(3), 70-75. https://doi.org/10.11648/j.mma.20240903.13
 Copy
|
Copy
|
 Download
ACS Style
Filho, F. M. O.; Oliveira, P. H. B. D.; Santos, S. E. D. F.; Santos, A. A. B.; Zebende, G. F. Analysis of Electroencephalographic Signals Using the Root Mean Square (RMS) Fluctuation Function: Applicable Sample Test. Math. Model. Appl. 2024, 9(3), 70-75. doi: 10.11648/j.mma.20240903.13
Copy
|
Download
AMA Style
Filho FMO, Oliveira PHBD, Santos SEDF, Santos AAB, Zebende GF. Analysis of Electroencephalographic Signals Using the Root Mean Square (RMS) Fluctuation Function: Applicable Sample Test. Math Model Appl. 2024;9(3):70-75. doi: 10.11648/j.mma.20240903.13
Copy
|
Download
-
@article{10.11648/j.mma.20240903.13,
  author = {Florêncio Mendes Oliveira Filho and Pedro Henrique Barros de Oliveira and Sanval Ebert de Freitas Santos and Alex Alisson Bandeira Santos and Gilney Figueira Zebende},
  title = {Analysis of Electroencephalographic Signals Using the Root Mean Square (RMS) Fluctuation Function: Applicable Sample Test
},
  journal = {Mathematical Modelling and Applications},
  volume = {9},
  number = {3},
  pages = {70-75},
  doi = {10.11648/j.mma.20240903.13},
  url = {https://doi.org/10.11648/j.mma.20240903.13},
  eprint = {https://article.sciencepublishinggroup.com/pdf/10.11648.j.mma.20240903.13},
  abstract = {Brain signals extracted through brain-computer interface systems (BCI2000- http://www.bci2000.org) allow researchers and computer scientists to cooperate with techniques, mathematical models and statistical inferences that allow the interpretation of a variety of signals provided by people with conditions that significantly affect the ability to move or perform motor activities due to limitations in muscles, bones or nervous system. For this study, we propose a preliminary test with the root mean square (rms) fluctuation function, with EEG data, whose task was the response given to real/imaginary motor stimulus. To validate the model and all the steps up to the configuration of the rms function, we chose the information contained in the EEG of subject S003, available in the public database https://physionet.org/content/eegmmidb/1.0.0/. Considering the distribution of electrodes in the brain (lobes: frontal, parietal, temporal and occipital) and given the data availability conditions (10 - 10 system, EDF format and 160 samples per second), we analyzed 12 of the 64 channels and four stimuli, namely: opening and closing the left or right fist, imagining opening and closing the left or right fist, opening and closing both fists or both feet and imagining opening and closing both fists or both feet. We evaluated their fluctuations individually and the amplitudes of channels 32 and 37 in relation to the others (11, 22, 24, 43, 44, 49, 54, 61, 63 and 64). We observed quantitative similarities when the brain performs the same real/imaginary motor task and that the time of the amplitude changes with the increase of the scale n (time scales). In all experiments (S003_R3, S003_R4, S003_R5, S003_R6), channel 32 x 24, for n > 20 (15 seconds) was smaller than the others, showing that channel 32 (left hemisphere) has the largest fluctuation. From data processing (.EDF) to visualization of FDFA/∆log curves, we conclude that it is possible to replicate the study for more channels, as well as to investigate other types of activities in the human brain adapted to potential variations (DDP) generated by neurons via signals extracted from the EEG device.
},
 year = {2024}
}
Copy
|
Download
-
TY  - JOUR
T1  - Analysis of Electroencephalographic Signals Using the Root Mean Square (RMS) Fluctuation Function: Applicable Sample Test

AU  - Florêncio Mendes Oliveira Filho
AU  - Pedro Henrique Barros de Oliveira
AU  - Sanval Ebert de Freitas Santos
AU  - Alex Alisson Bandeira Santos
AU  - Gilney Figueira Zebende
Y1  - 2024/09/29
PY  - 2024
N1  - https://doi.org/10.11648/j.mma.20240903.13
DO  - 10.11648/j.mma.20240903.13
T2  - Mathematical Modelling and Applications
JF  - Mathematical Modelling and Applications
JO  - Mathematical Modelling and Applications
SP  - 70
EP  - 75
PB  - Science Publishing Group
SN  - 2575-1794
UR  - https://doi.org/10.11648/j.mma.20240903.13
AB  - Brain signals extracted through brain-computer interface systems (BCI2000- http://www.bci2000.org) allow researchers and computer scientists to cooperate with techniques, mathematical models and statistical inferences that allow the interpretation of a variety of signals provided by people with conditions that significantly affect the ability to move or perform motor activities due to limitations in muscles, bones or nervous system. For this study, we propose a preliminary test with the root mean square (rms) fluctuation function, with EEG data, whose task was the response given to real/imaginary motor stimulus. To validate the model and all the steps up to the configuration of the rms function, we chose the information contained in the EEG of subject S003, available in the public database https://physionet.org/content/eegmmidb/1.0.0/. Considering the distribution of electrodes in the brain (lobes: frontal, parietal, temporal and occipital) and given the data availability conditions (10 - 10 system, EDF format and 160 samples per second), we analyzed 12 of the 64 channels and four stimuli, namely: opening and closing the left or right fist, imagining opening and closing the left or right fist, opening and closing both fists or both feet and imagining opening and closing both fists or both feet. We evaluated their fluctuations individually and the amplitudes of channels 32 and 37 in relation to the others (11, 22, 24, 43, 44, 49, 54, 61, 63 and 64). We observed quantitative similarities when the brain performs the same real/imaginary motor task and that the time of the amplitude changes with the increase of the scale n (time scales). In all experiments (S003_R3, S003_R4, S003_R5, S003_R6), channel 32 x 24, for n > 20 (15 seconds) was smaller than the others, showing that channel 32 (left hemisphere) has the largest fluctuation. From data processing (.EDF) to visualization of FDFA/∆log curves, we conclude that it is possible to replicate the study for more channels, as well as to investigate other types of activities in the human brain adapted to potential variations (DDP) generated by neurons via signals extracted from the EEG device.

VL  - 9
IS  - 3
ER  -
Copy
|
Download